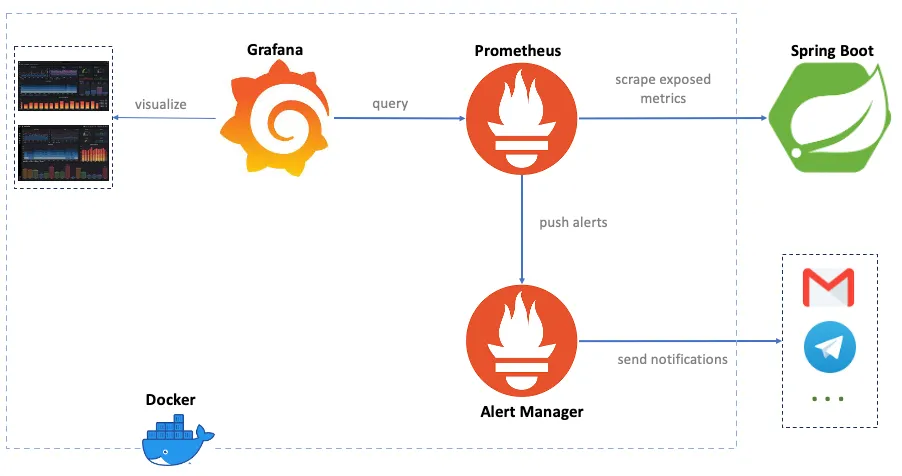
📌개요 Spring Boot 프로젝트에서 Prometheus, Grafana를 연동해 시간의 흐름에 따라 변동되는 메트릭(Metrics) 데이터를 시각화해보자.
📌내용 사전 준비 Spring Boot 프로젝트spring-boot-actuator micrometer-registry-prometheus Docker 또는 Docker Desktop docker-compose.yml prometheus.yml build.gradle 1
2
3
4
5
6
dependencies {
//...
implementation 'org.springframework.boot:spring-boot-starter-actuator'
implementation 'io.micrometer:micrometer-registry-prometheus'
//...
}
application.yml 1
2
3
4
5
6
7
8
9
management :
endpoints :
web :
exposure :
include : "prometheus"
metrics :
export :
prometheus :
enabled : true
docker-compose.yml Docker 서비스 실행 자동화 설정
여러 Docker 컨테이너(Prometheus, Grafana 등)를 한 번에 실행/종료/관리하기 위한 설정
1
2
3
4
5
6
7
8
9
10
11
12
13
14
15
16
17
18
19
20
21
22
services :
prometheus :
image : prom/prometheus:latest # Prometheus 공식 이미지
container_name : prometheus # 컨테이너 이름 지정, 내부 DNS로도 사용돤다. ex)http://prometheus:9090
volumes :
- ./prometheus.yml:/etc/prometheus/prometheus.yml # 로컬 설정 파일을 컨테이너에 마운트
ports :
- "9090:9090" # 호스트의 9090 → 컨테이너의 9090 (Prometheus 웹 UI)
networks :
- monitoring # 아래 정의한 사용자 정의 네트워크에 연결
grafana :
image : grafana/grafana:latest # Grafana 공식 이미지
container_name : grafana # 컨테이너 이름 지정
ports :
- "3000:3000" # 호스트의 3000 → 컨테이너의 3000 (Grafana 웹 UI)
networks :
- monitoring # 같은 네트워크에 있어야 prometheus:9090 접근 가능
# 사용자 정의 네트워크 정의 (서로 통신 가능하게 함)
networks :
monitoring : # 네트워크 이름만 지정하면 default 설정으로 생성됨
왜 networks.monitoring은 비어있는가?
이건 사용자 정의 브리지 네트워크를 선언하는 부분이고 따로 옵션(예 driver)을 주지 않으면 Docoker가 기본값으로 설정된 브리지 네트워크를 생성한다. 명시적으로 정의도 가능하지만 대부분의 경우 생략해도 무방하다.1
2
3
networks :
monitoring :
driver : bridge
실행 명령어 Docker Desktop이 설치되어 있어야 docker-compose 명령 사용 가능
1
2
docker-compose up # 실행
docker-compose down # 종료
prometheus.yml Prometheus 수집 대상 설정 파일
Prometheus가 어떤 서버나 앱의 메트릭을 수집할지 설정하는 파일
host.docker.internal은 Docker 컨테이너가 로컬 호스트의 Spring Boot 앱에 접근하기 위한 주소다. (Mac/Windows 한정. Linux는 다르다)
1
2
3
4
5
6
7
8
9
global :
scrape_interval : 5s # 모든 타겟을 5초마다 스크랩(메트릭 수집)함
scrape_configs :
- job_name : 'spring-app' # 수집 작업 이름 (Prometheus UI에서 구분용)
metrics_path : '/actuator/prometheus' # 메트릭이 노출되는 경로 (Spring Boot 기준)
scrape_interval : 3s # 3초 마다 metrics_path의 경로에 접근하여 메트릭 데이터를 수집
static_configs :
- targets : [ 'host.docker.internal:8080' ] # 타겟 주소 (로컬 Spring Boot 앱)
실행 docker-compose.yml 파일이 있는 경로로 이동해서 docker-compose up 명령을 실행하면 Docker에 알맞게 Volume, Images, Container 생성되며 빌드된다.
정상적으로 아래 출력을 확인했다면 localhost:9090에 접속하면 Prometheus UI를 확인할 수 있다.
변경 발생 시 사용할 명령어 1
2
3
4
docker-compose down
docker-compose up --build

docker restart prometheus
docker-compose up 명령 시 출력 예시 1
2
3
4
5
6
7
8
9
10
11
12
13
14
15
16
17
18
19
20
21
22
23
24
25
26
27
28
29
30
31
32
33
34
35
36
37
38
39
40
41
42
43
44
45
46
47
48
49
50
51
52
53
54
55
56
57
58
59
60
61
62
docker-compose up
[ +] Running 22/22
✔ grafana Pulled 12.2s
✔ f18232174bc9 Pull complete 1.6s
✔ 055b9255fa03 Pull complete 0.8s
✔ f61a19743345 Pull complete 2.0s
✔ b176d7edde70 Pull complete 0.4s
✔ e60d9caeb0b8 Pull complete 0.8s
✔ e032d0a5e409 Pull complete 0.8s
✔ c49e0ee60bfb Pull complete 7.3s
✔ 384497dbce3b Pull complete 9.4s
✔ c53a11b7c6fc Pull complete 0.8s
✔ 8af57d8c9f49 Pull complete 2.2s
✔ prometheus Pulled 8.1s
✔ 7df673c7455d Pull complete 0.3s
✔ 6ac0e4adf315 Pull complete 4.1s
✔ 408012a7b118 Pull complete 0.9s
✔ 1ccde423731d Pull complete 1.0s
✔ 1617e25568b2 Pull complete 1.7s
✔ 7221d93db8a9 Pull complete 2.0s
✔ 9fa9226be034 Pull complete 1.3s
✔ bf70c5107ab5 Pull complete 0.8s
✔ f3b09c502777 Pull complete 4.9s
✔ 44986281b8b9 Pull complete 0.9s
[ +] Running 3/3
✔ Network resources_monitoring Created 0.1s
✔ Container prometheus Created 0.5s
✔ Container grafana Created 0.5s
Attaching to grafana, prometheus
prometheus | time = 2025-06-17T12:40:19.321Z level = INFO source = main.go:674 msg = "No time or size retention was set so using the default time retention" duration = 15d
prometheus | time = 2025-06-17T12:40:19.321Z level = INFO source = main.go:725 msg = "Starting Prometheus Server" mode = server version = "(version=3.4.1, branch=HEAD, revision=aea6503d9bbaad6c5faff3ecf6f1025213356c92)"
prometheus | time = 2025-06-17T12:40:19.321Z level = INFO source = main.go:730 msg = "operational information" build_context = "(go=go1.24.3, platform=linux/amd64, user=root@16f976c24db1, date=20250531-10:44:38, tags=netgo,builtinassets,stringlabels)" host_details = "(Linux 5.15.167.4-microsoft-standard-WSL2 #1 SMP Tue Nov 5 00:21:55 UTC 2024 x86_64 999bf7192f26 )" fd_limits = "(soft=1048576, hard=1048576)" vm_limits = "(soft=unlimited, hard=unlimited)"
prometheus | time = 2025-06-17T12:40:19.322Z level = INFO source = main.go:806 msg = "Leaving GOMAXPROCS=12: CPU quota undefined" component = automaxprocs
prometheus | time = 2025-06-17T12:40:19.324Z level = INFO source = web.go:656 msg = "Start listening for connections" component = web address = 0.0.0.0:9090
prometheus | time = 2025-06-17T12:40:19.324Z level = INFO source = main.go:1266 msg = "Starting TSDB ..."
prometheus | time = 2025-06-17T12:40:19.327Z level = INFO source = tls_config.go:347 msg = "Listening on" component = web address =[ ::] :9090
prometheus | time = 2025-06-17T12:40:19.327Z level = INFO source = tls_config.go:350 msg = "TLS is disabled." component = web http2 = false address =[ ::] :9090
prometheus | time = 2025-06-17T12:40:19.329Z level = INFO source = head.go:657 msg = "Replaying on-disk memory mappable chunks if any" component = tsdb
prometheus | time = 2025-06-17T12:40:19.329Z level = INFO source = head.go:744 msg = "On-disk memory mappable chunks replay completed" component = tsdb duration = 972ns
prometheus | time = 2025-06-17T12:40:19.329Z level = INFO source = head.go:752 msg = "Replaying WAL, this may take a while" component = tsdb
prometheus | time = 2025-06-17T12:40:19.329Z level = INFO source = head.go:825 msg = "WAL segment loaded" component = tsdb segment = 0 maxSegment = 0 duration = 156.935µs
prometheus | time = 2025-06-17T12:40:19.329Z level = INFO source = head.go:862 msg = "WAL replay completed" component = tsdb checkpoint_replay_duration = 28.265µs wal_replay_duration = 187.212µs wbl_replay_duration = 133ns chunk_snapshot_load_duration = 0s mmap_chunk_replay_duration = 972ns total_replay_duration = 249.607µs
prometheus | time = 2025-06-17T12:40:19.330Z level = INFO source = main.go:1287 msg = "filesystem information" fs_type = EXT4_SUPER_MAGIC
prometheus | time = 2025-06-17T12:40:19.330Z level = INFO source = main.go:1290 msg = "TSDB started"
prometheus | time = 2025-06-17T12:40:19.330Z level = INFO source = main.go:1475 msg = "Loading configuration file" filename = /etc/prometheus/prometheus.yml
prometheus | time = 2025-06-17T12:40:19.331Z level = INFO source = main.go:1514 msg = "updated GOGC" old = 100 new = 75
prometheus | time = 2025-06-17T12:40:19.331Z level = INFO source = main.go:1524 msg = "Completed loading of configuration file" db_storage = 820ns remote_storage = 800ns web_handler = 248ns query_engine = 572ns scrape = 325.871µs scrape_sd = 23.08µs notify = 68.448µs notify_sd = 7.122µs rules = 1.01µs tracing = 2.927µs filename = /etc/prometheus/prometheus.yml totalDuration = 641.79µs
prometheus | time = 2025-06-17T12:40:19.331Z level = INFO source = main.go:1251 msg = "Server is ready to receive web requests."
prometheus | time = 2025-06-17T12:40:19.331Z level = INFO source = manager.go:175 msg = "Starting rule manager..." component = "rule manager"
grafana | logger = settings t = 2025-06-17T12:40:19.580946399Z level = info msg = "Starting Grafana" version = 12.0.1+security-01 commit = ff20b06681749873999bb0a8e365f24fddaee33f branch = HEAD compiled = 2025-06-17T12:40:19Z
grafana | logger = settings t = 2025-06-17T12:40:19.581187455Z level = info msg = "Config loaded from" file = /usr/share/grafana/conf/defaults.ini
grafana | logger = settings t = 2025-06-17T12:40:19.581202298Z level = info msg = "Config loaded from" file = /etc/grafana/grafana.ini
grafana | logger = settings t = 2025-06-17T12:40:19.581205854Z level = info msg = "Config overridden from command line" arg = "default.paths.data=/var/lib/grafana"
grafana | logger = settings t = 2025-06-17T12:40:19.581208666Z level = info msg = "Config overridden from command line" arg = "default.paths.logs=/var/log/grafana"
grafana | logger = settings t = 2025-06-17T12:40:19.581212098Z level = info msg = "Config overridden from command line" arg = "default.paths.plugins=/var/lib/grafana/plugins"
grafana | logger = settings t = 2025-06-17T12:40:19.581215368Z level = info msg = "Config overridden from command line" arg = "default.paths.provisioning=/etc/grafana/provisioning"
grafana | logger = settings t = 2025-06-17T12:40:19.5812188Z level = info msg = "Config overridden from command line" arg = "default.log.mode=console"
grafana | logger = settings t = 2025-06-17T12:40:19.581222384Z level = info msg = "Config overridden from Environment variable" var = "GF_PATHS_DATA=/var/lib/grafana"
grafana | logger = settings t = 2025-06-17T12:40:19.58122533Z level = info msg = "Config overridden from Environment variable" var = "GF_PATHS_LOGS=/var/log/grafana"
grafana | logger = settings t = 2025-06-17T12:40:19.581228361Z level = info msg = "Config overridden from Environment variable" var = "GF_PATHS_PLUGINS=/var/lib/grafana/plugins"
grafana | logger = settings t = 2025-06-17T12:40:19.581230583Z level = info msg = "Config overridden from Environment variable" var = "GF_PATHS_PROVISIONING=/etc/grafana/provisioning"
...
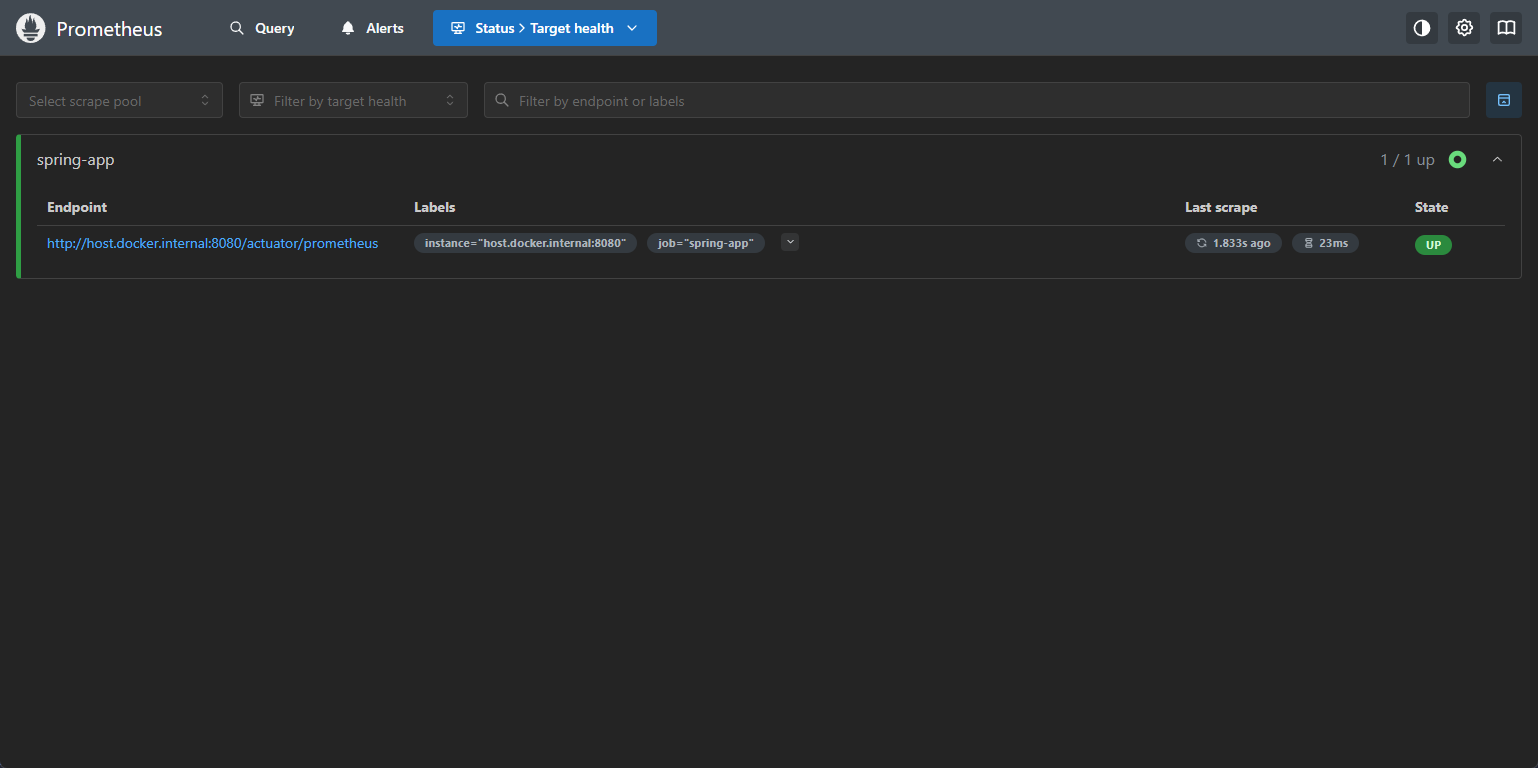
Prometheus UI http://localhost:9090으로 접속했다면 Status > Targets의 타겟 상태가 UP 상태로 잘 올라와 있는지 확인한다.
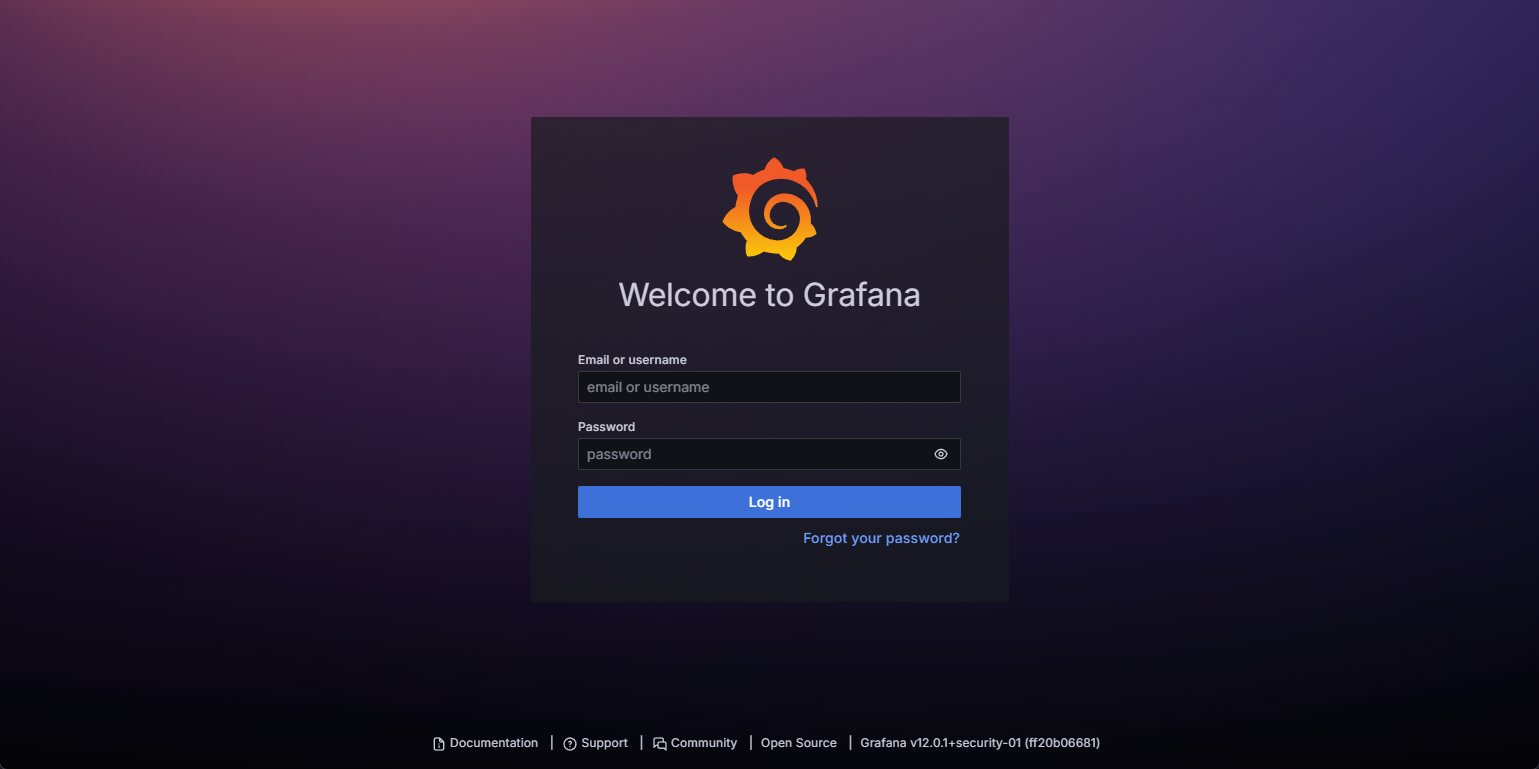
Grafana UI 설정해둔 주소 localhost:3000 접속 후 별다른 설정을 하지 않았다면 기본 로그인 정보인 (id: admin, pw: admin)으로 로그인한다.
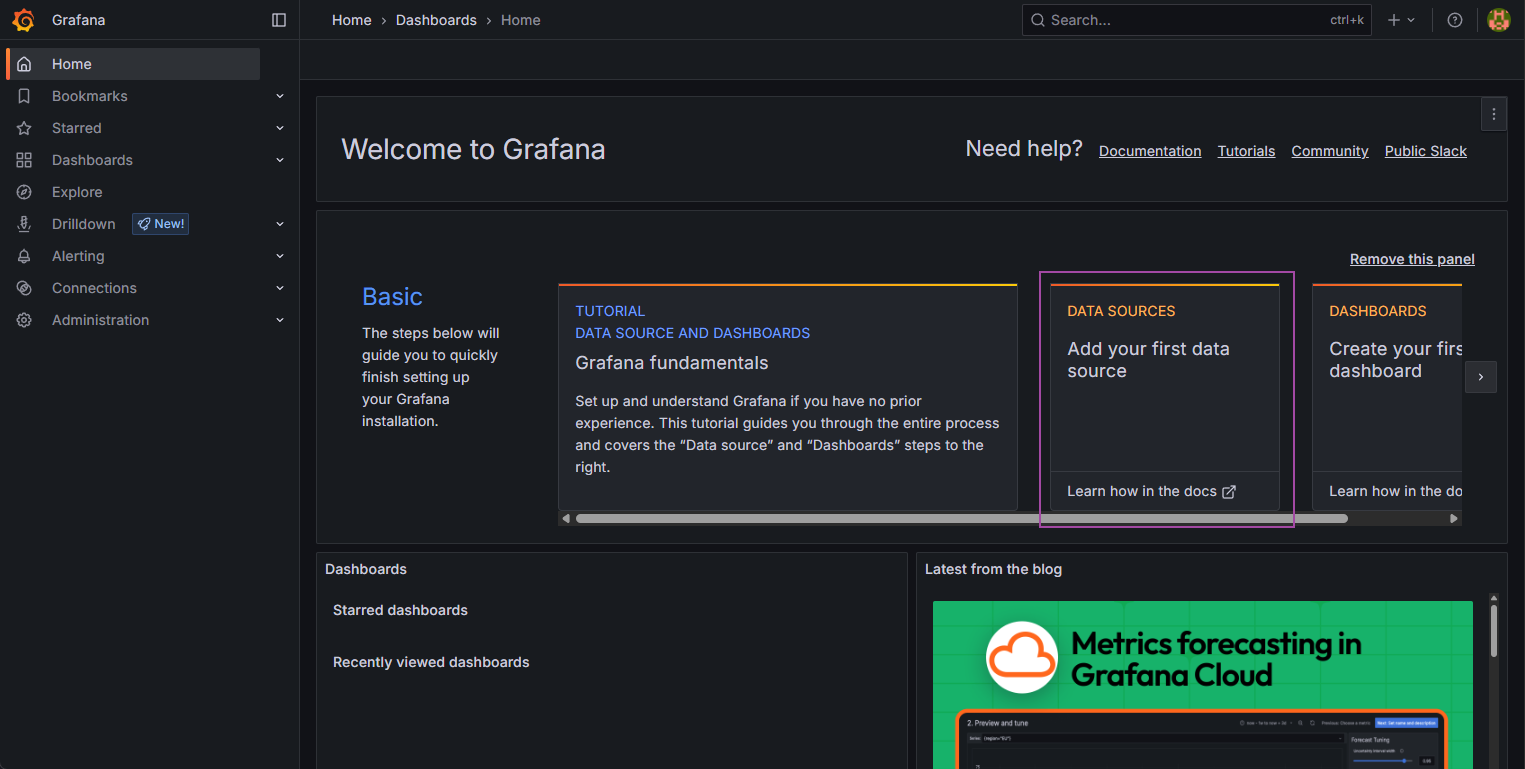
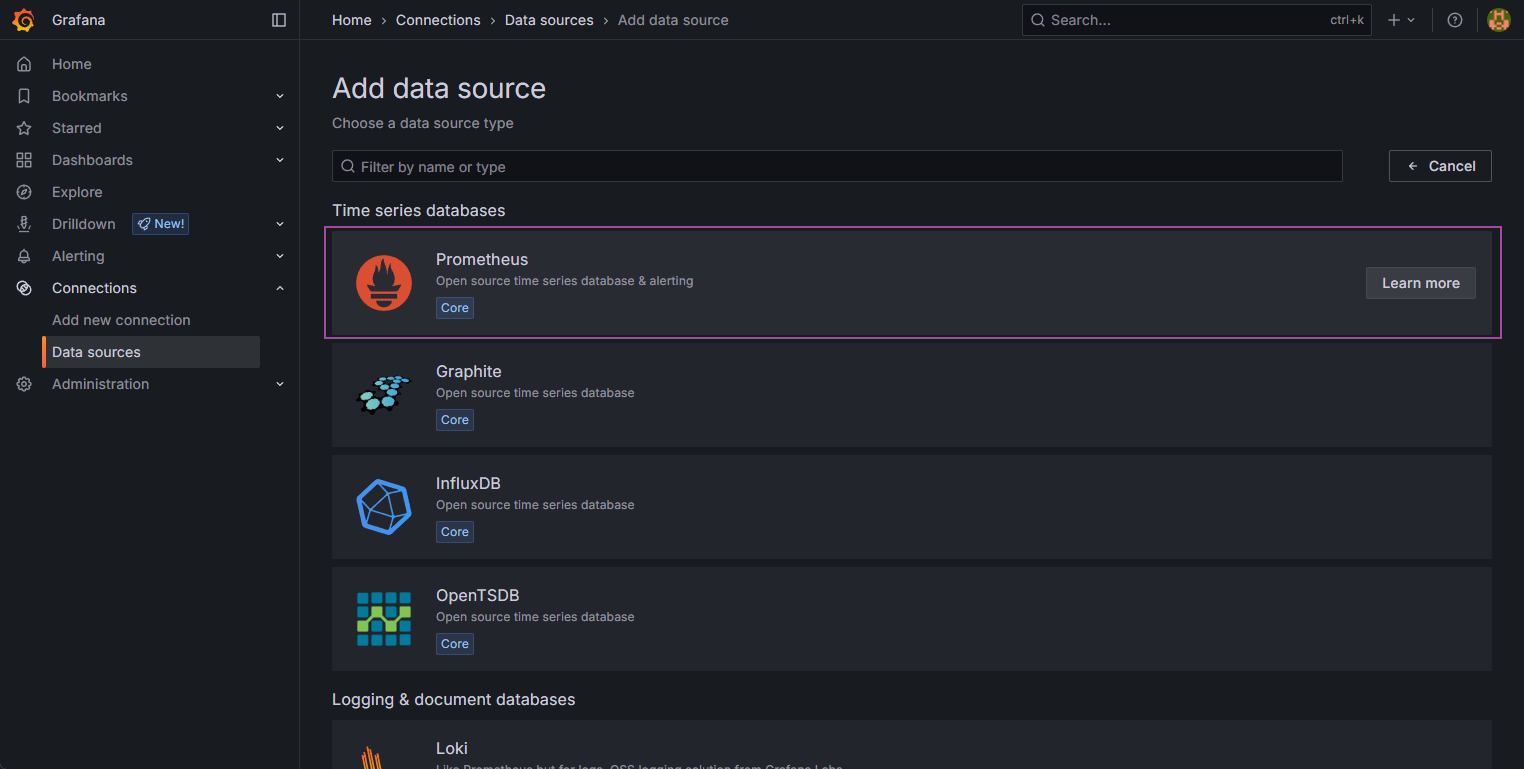
DATA SOURCES Add your first data source 클릭 이동
Prometheus 클릭
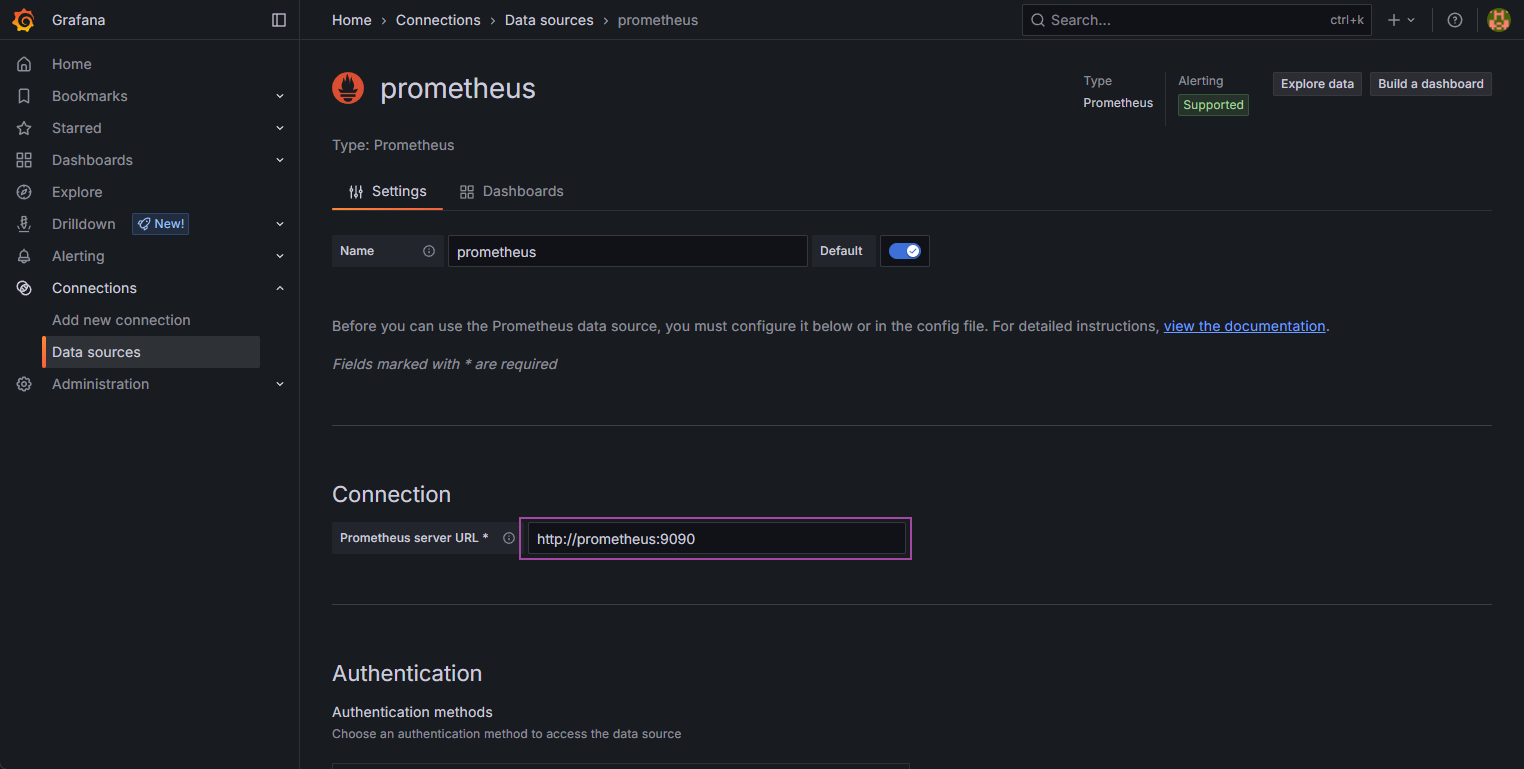
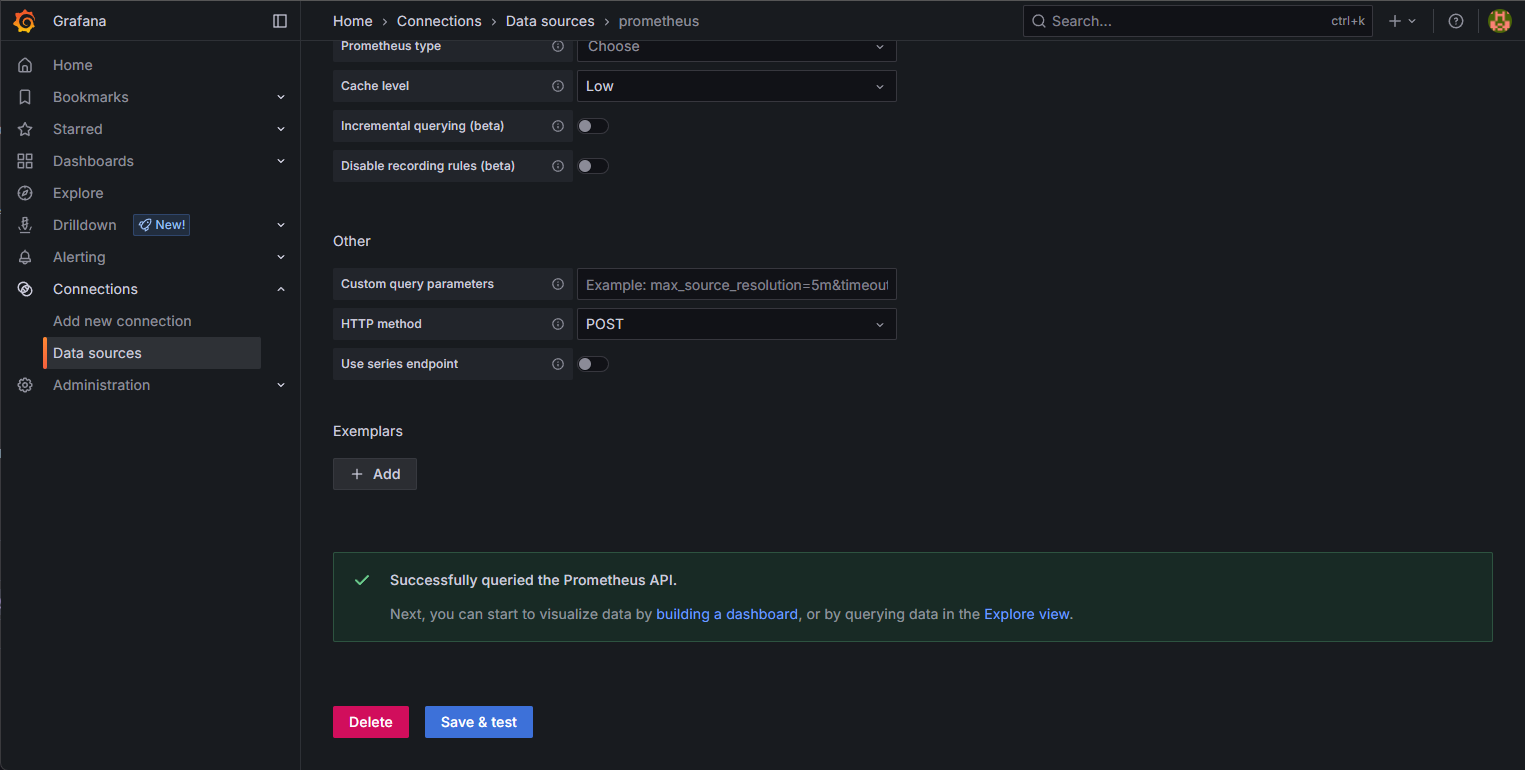
설정했던 http://prometheus:9090 입력 후 저장
주의할 것은 localhost 아니고 docker-compose.yml에서 설정한 컨테이너 이름이자 내부 DNS를 prometheus로 사용
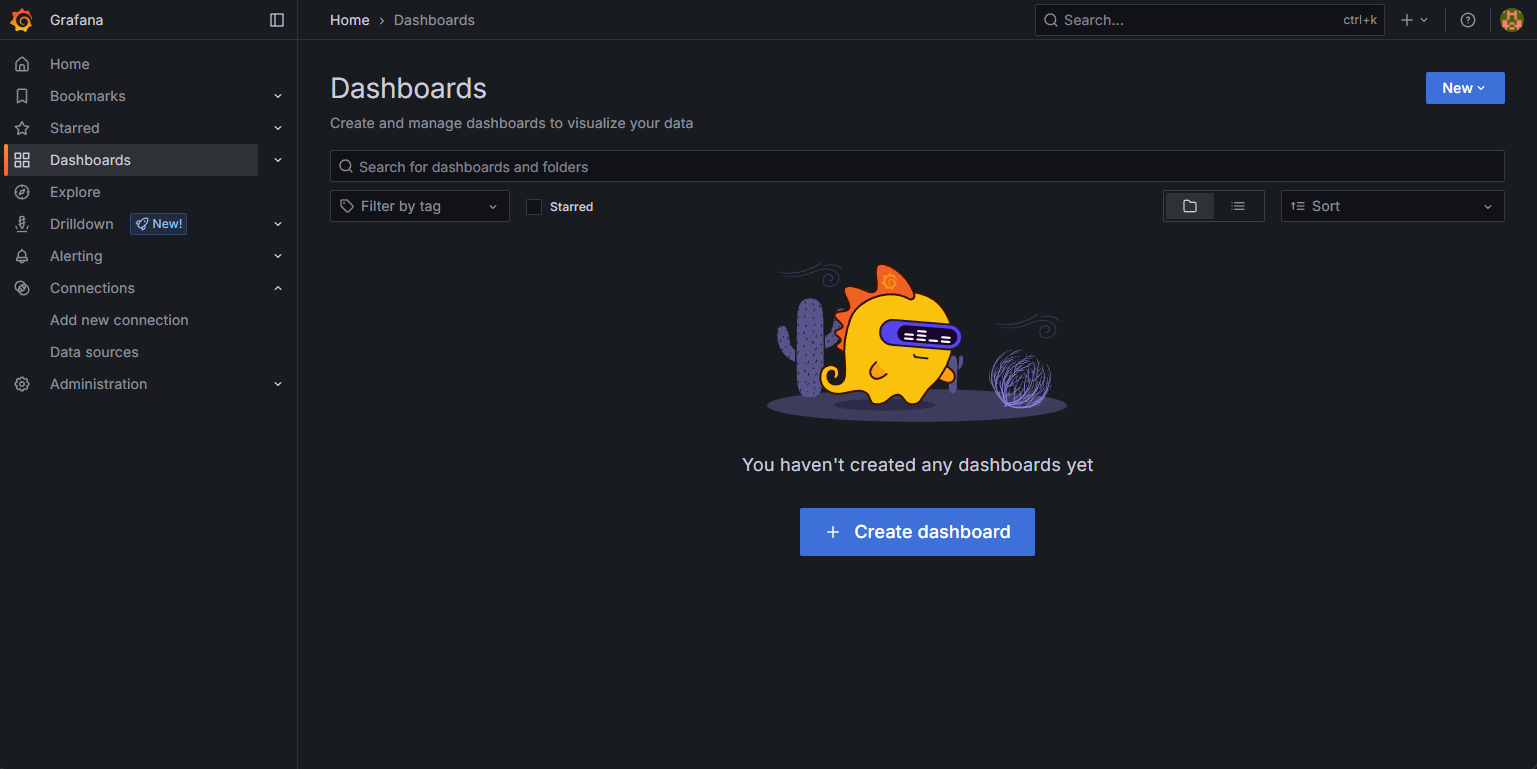
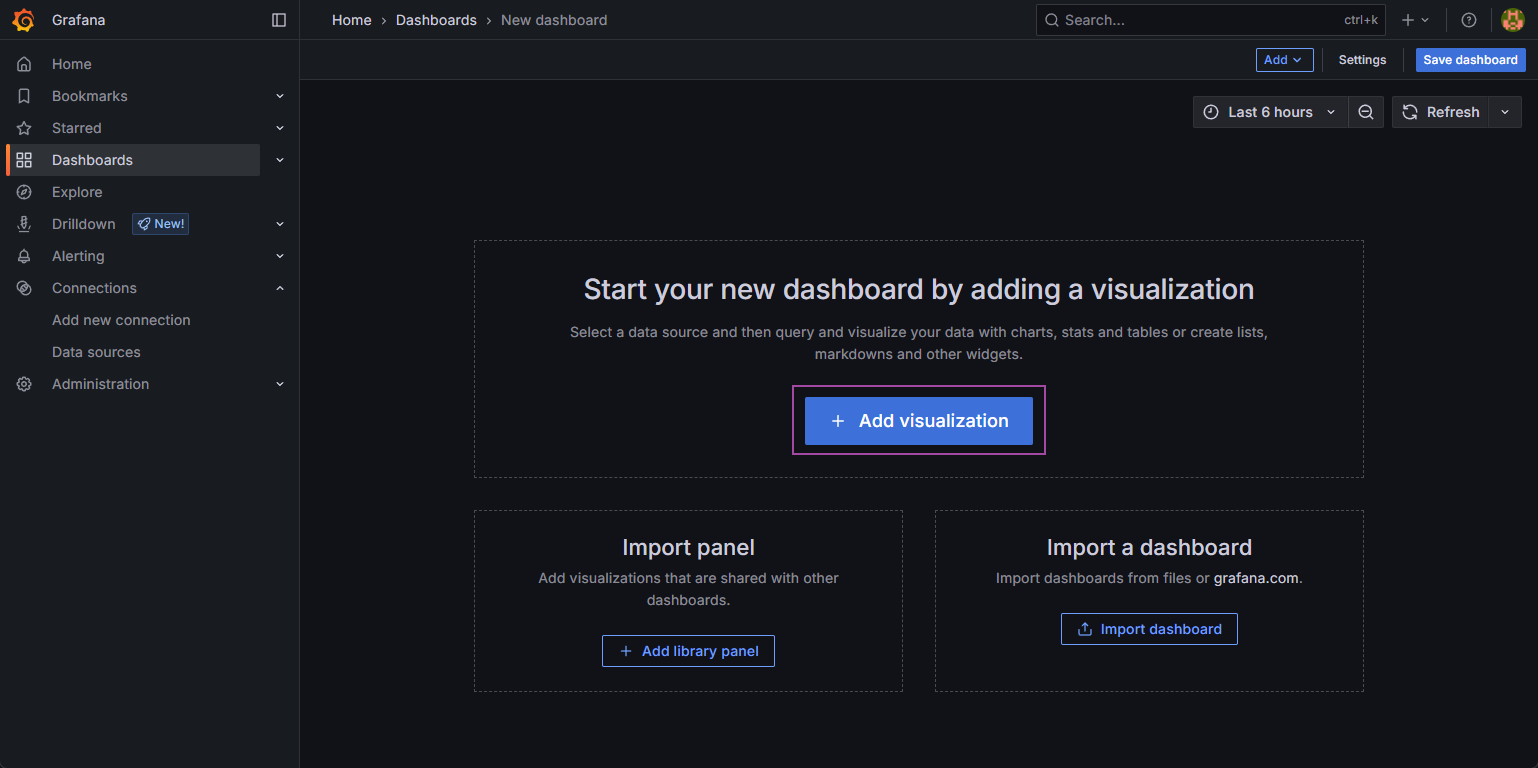
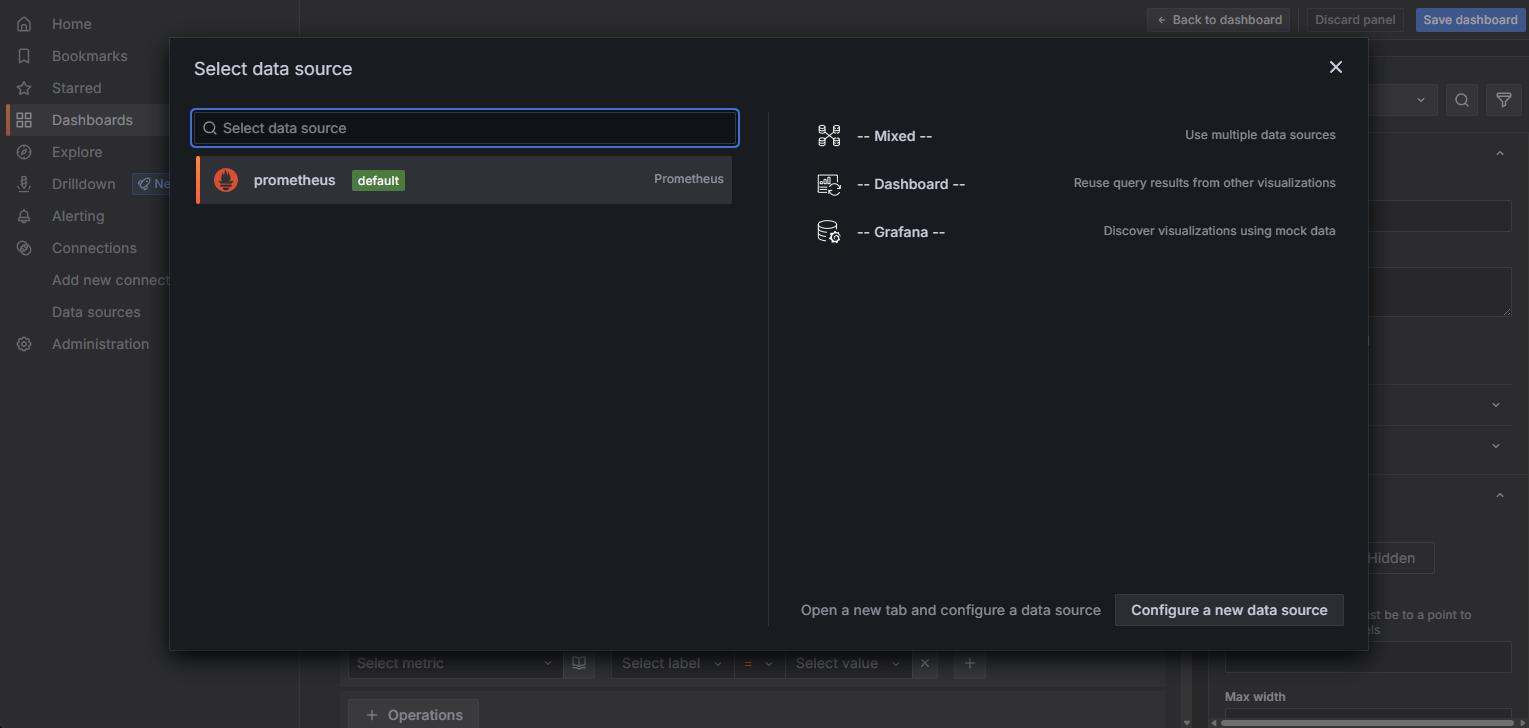
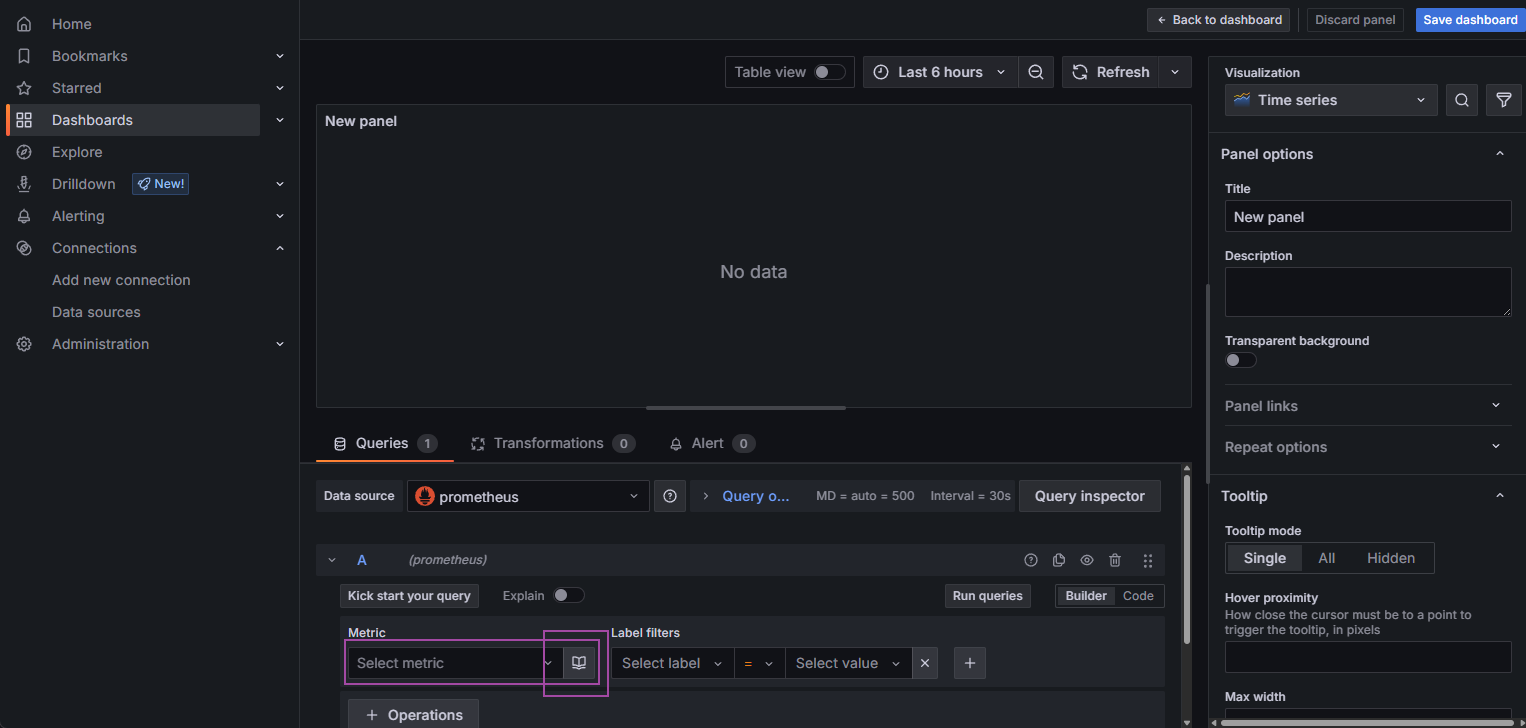
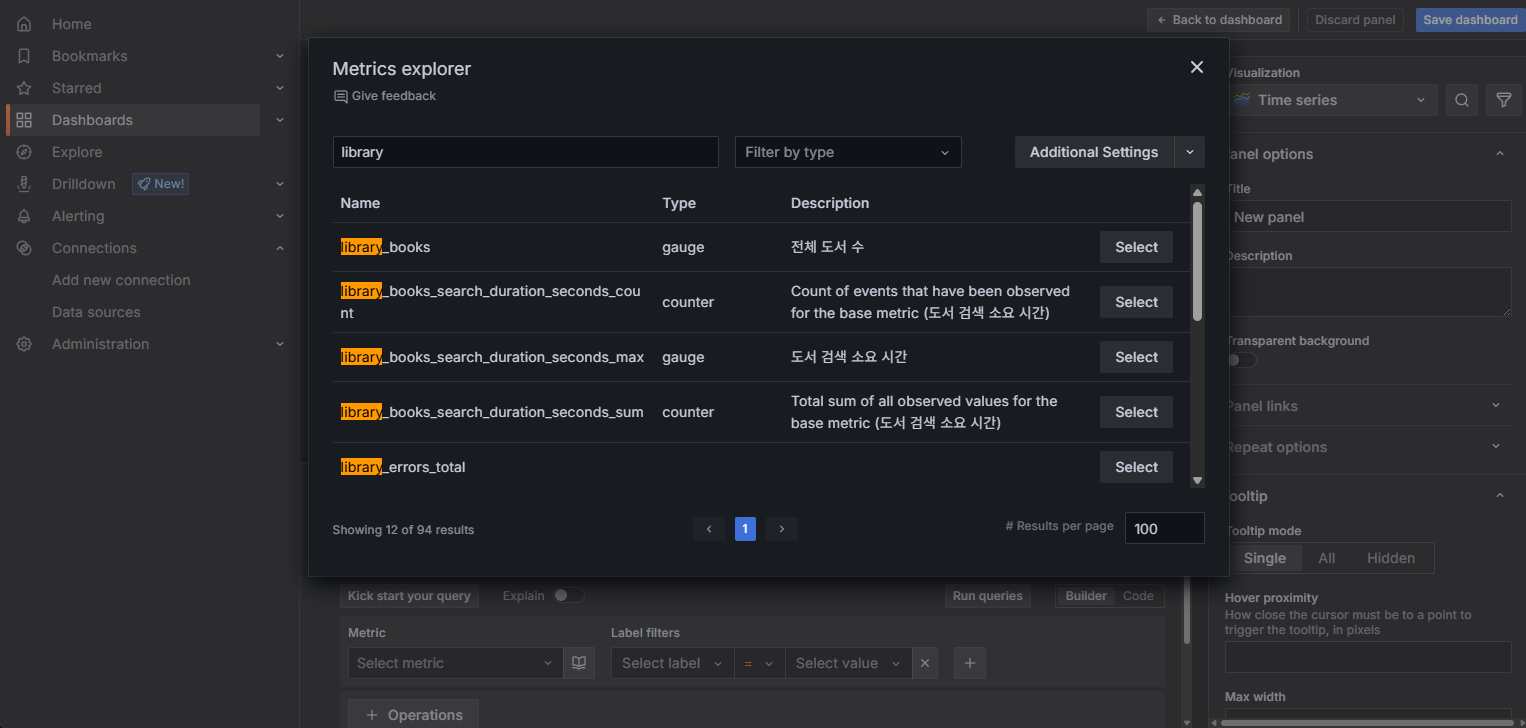
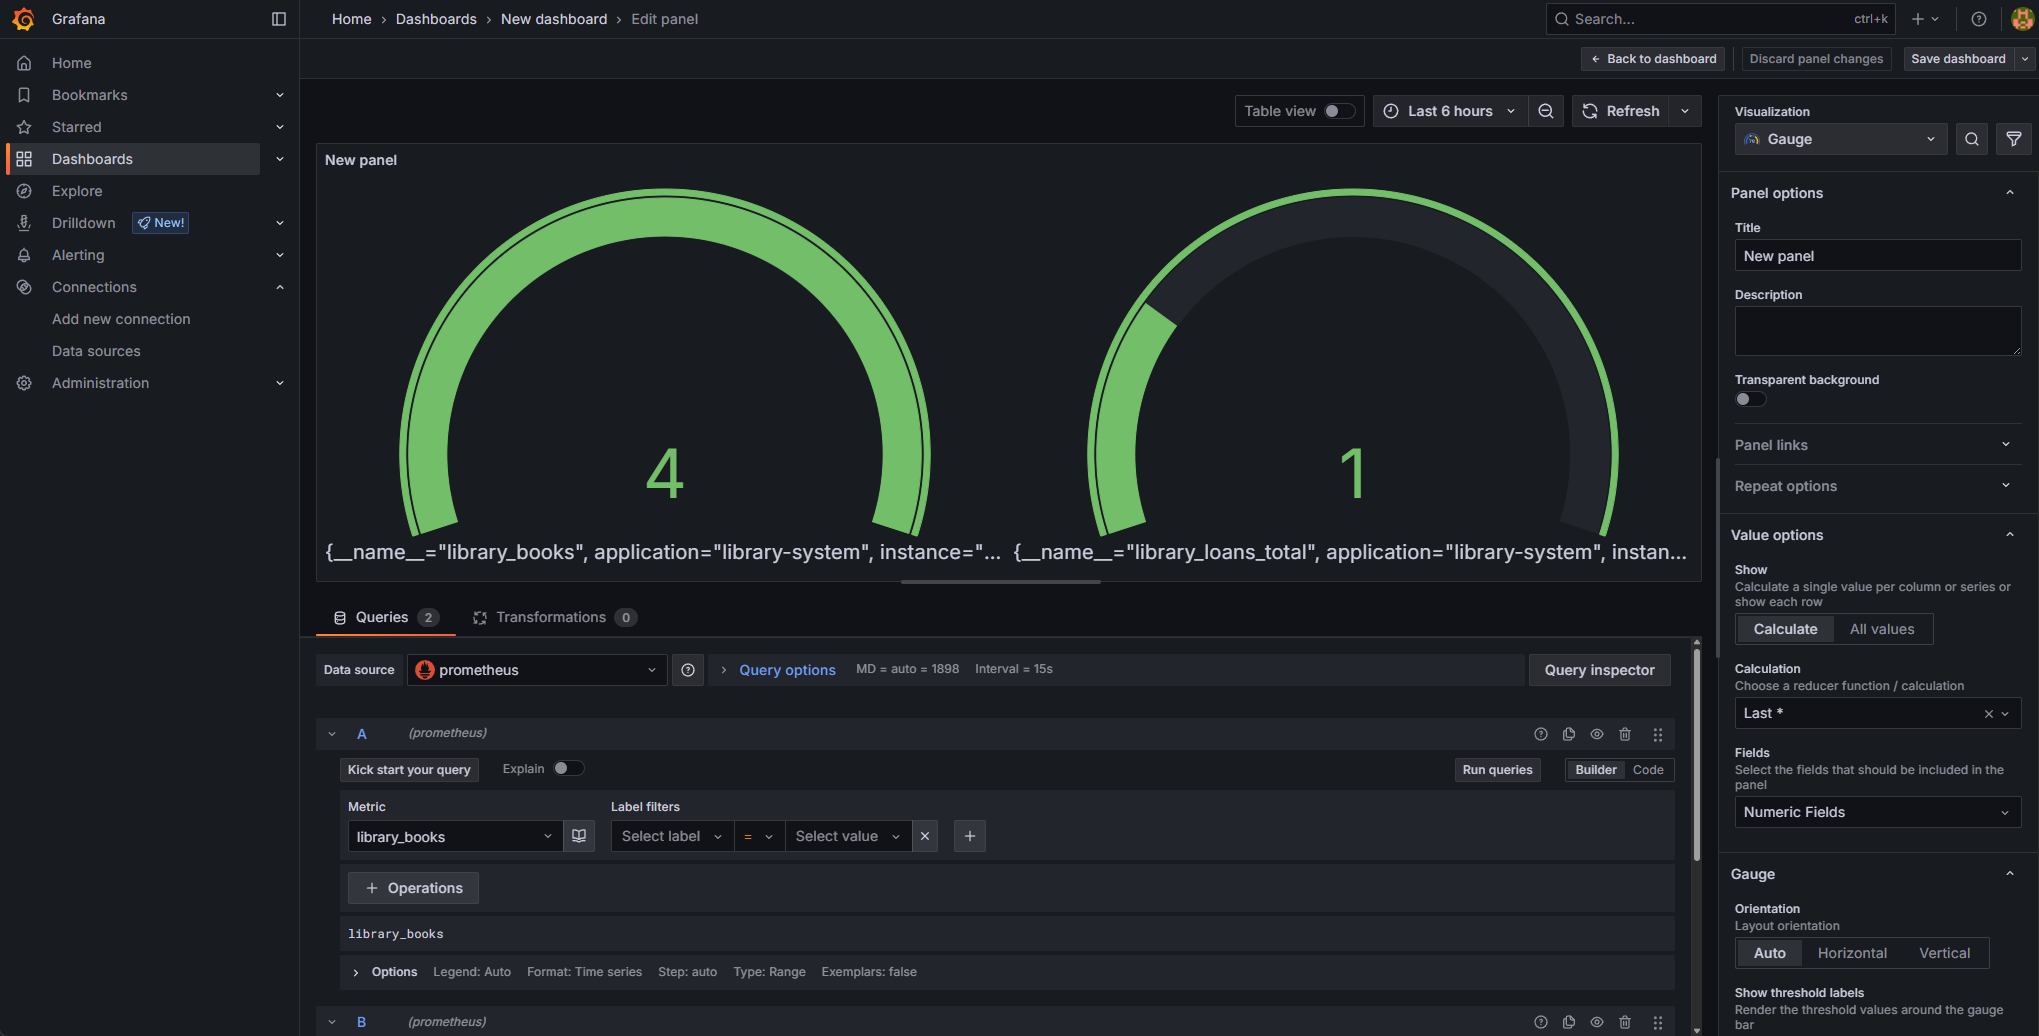
대시보드 생성
대시보드 추가 과정
yml? yaml? yaml 확장자로 했을 때 Prometheus Status 잘 올라오지 않았고 별다른 설정 문제가 아니라면 기본적으로 찾게되는 확장자가 yml인가 싶어 변경했더니 잘 올라왔다.
YAML과 YML은 ==파일 확장자만 다를 뿐, 본질적으로 같은 것을 가리킵니다==. YAML은 “YAML Ain’t Markup Language"의 약자로, 사람이 읽기 쉬운 데이터 직렬화 언어입니다.
Yaml Ain’t Markup Language 또는 Yet Another Markup Language
.html 대신 .htm으로도 사용된 것과 같이 옛날 옛날 한 옛날 Windows에서 Extensions는 파일 확장자가 3자로 제한되는 특성이 있었기 때문이라고 한다.
🎯결론 시스템의 가시성과 안정성을 높이기 위한 가장 빠르고 효과적인 방법은 Prometheus와 Grafana를 Docker로 연동해 메트릭을 시각화하는 것이다.
이 방식은 별도 설치 없이 빠르게 시작할 수 있으며 Spring Boot의 Actuator와 Micrometer를 활용하면 애플리케이션의 상태와 예외 흐름까지도 실시간으로 모니터링할 수 있다.
운영 환경 이전에 개발 및 테스트 단계부터 시각화 환경을 구축해두는 것이 예외 대응력과 시스템 품질을 높이는 핵심 전략이 된다.